AAWU |
Product
Descriptions |
|
| TEXT
PRODUCTS - Area Forecasts - TAF's GRAPHIC PRODUCTS OBSERVATIONS
AND
|
This section contains explanations of the
following products:
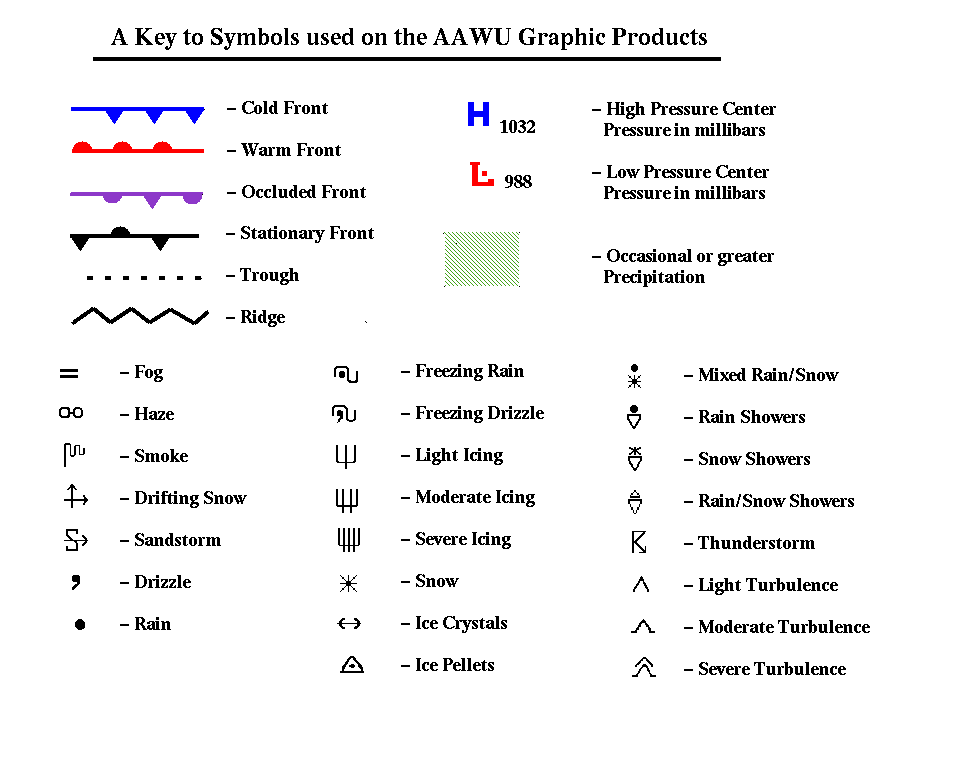
Area Forecasts - FA (text) Each FA contains a regional synopsis, 12-hour geographic specific forecasts, and an 18-hour outlook for each geographic area. Forecast weather elements are sky condition, cloud height, mountain obscuration, visibility, weather and/or obstructions to visibility, strong surface winds (direction & speed), icing, freezing level, and mountain pass conditions. Hazards and flight precautions, including AIRMETs and SIGMETs, may be found in their respective geographic area. All times unless stated otherwise are Coordinated Universal Time (UTC) denoted by the suffix Z. UTC is commonly known as Greenwich Mean Time (GMT) or Zulu time. For a translation of the contractions used in the FA, please visit the Contractions Glossary. The header for the FA follows the general form: iii(H or C) FA ddhhmm where iii is the area identifier (ANC - Anchorage, FAI - Fairbanks, JNU - Juneau), H or C designates sections of the FA, and ddhhmm is the date, hour, and time (UTC) of issuance. The ddhhmm format is used throughout the FA for times. The header is followed by the generic AIRMET code: TS IMPLY POSSIBLE SEV OR GREATER TURB SEV ICE LLWS AND IFR CONDS. NON MSL HEIGHTS NOTED BY AGL OR CEILING. This translates to thunderstorms imply possible severe or greater turbulence, severe icing, low level wind shear, and instrument flight rules conditions. Non-mean sea level heights noted by above ground level or ceiling. All heights in the FA are taken from mean sea level unless stated otherwise. AIRMETs designate conditions that are detrimental to small crafts: large area moderate turbulence, icing, instrument flight rules (ceilings less that 1000 ft and/or visibility less than 3 miles. SIGMETS warn all aircraft of severe-extreme icing, severe-extreme turbulence, and volcanic activity. Geographical Coverage Although the AAWU provides state-wide coverage of Area Forecasts, FA's are organized by geographical divisions The FA for southeast Alaska (Juneau - the panhandle) extends from the Eastern Gulf Coast through the Southeast Panhandle. The FA for the northern half (Fairbanks) of the mainland extends south to the Alaska Range, north to the Coastal Arctic Slope, and west to St. Lawrence Island, including Norton and Kotzebue Sounds. The FA for south central Alaska extends north to the Alaska Range, south to the Central Gulf Coast, west to Adak, east to the Copper River Basin. Issuance Times and Period UTC 0145 0745 1345 1945 ADT 1745 2345 0545 1145 UTC 0245 0845 1445 2045 AST 1745 2345 0545 1145 AAWU Graphic Products Graphic products present synoptic scale information for the entire state of Alaska. Images present information found in text forecasts in a graphical overview form. Images are meant to complement -- not replace -- the text FA. For an index of the symbols used on the Graphic Products, please visit the Symbols Glossary. The first suite of AAWU graphics are the four sets of maps that complement the FA. Please note the valid time on the header of these maps. They are for the specific time mentioned and are not meant to cover the entire valid time of the text FA. These maps are:
Issuance Times For the FA Graphics UTC 0900 1500 2100 0300 ADT 0100 0700 1300 1900 UTC 1000 1600 2200 0400 AST 0100 0700 1300 1900 The second suite of charts are the Significant Weather Charts, which are valid at either 24 or 36 hours from the current model run (either 00Z or 12Z). Again, please note the valid time on each map. These charts contain the following information:
Issuance Times For the Significant Weather Charts UTC 1700 0600 ADT 0900 2100 UTC 1800 0700 AST 0900 2100 |