Electronic chart packages are designed for navigation, not for fishing. Electronic chart packages help you move from one location to another as safely and expediently as possible. FishTrek is designed as a fishing tool that provides you with the data you need to make the most of each and every fishing trip. Like electronic chart packages, FishTrek provides you with real-time vessel display on a map driven by a data stream from a GPS, but that is where the similarity ends. Our maps are produced from vector, not raster data (see next question for a description of raster versus vector), allowing you to create a map with exactly the information you desire, and nothing more. By utilizing our bathymetric charts, it is possible to place the vessel exactly where you want relative to the bottom. By layering together different data types such as catch, sea surface temperature, and bathymetry you can detect those trends and patterns that provide the best opportunity for fishing success. In addition, FishTrek provides you with an integrated electronic logbook that makes data storage and retrieval fast and easy. In summary, electronic chart packages are for navigation, FishTrek is for fishing.
A raster map is a picture. Just like you have a picture on the wall, you have a picture on the screen. Each one of the pixel elements, or pixels, on the screen is just a representation of a picture. With a raster image you do not have any access to the objects in the picture, so if you have a picture of a coastline with bathymetry and buoy markers and shipping lanes, there is no way for you to select the shipping lanes, buoy markers or get a different type of coast line for that picture. With raster images, what you see is what you get. The accuracy of the chart is strictly limited to the its scale. Zooming in to 1:10,000 on a chart scaled at 1:40,000 is not only blurry and blocky, but it is possibly dangerous.
Vector maps are drawn on the computer screen from descriptions of the individual map elements. Each coastline is drawn from a list of points. Each point is drawn using its actual location. Each and every element on a vector map can be accessed. Because you are drawing each map, you define exactly what you want on the map and how you want it to look. For example, you might select bathymetry from 20 40 fathoms to be drawn as blue lines, the coastline to be at its highest resolution and drawn in green, and king crab catch over 100 crab per pot from your log book from the last three years shown as red circles where the size of the circle indicates the size of the catch. Unlike raster maps that are limited to the scale of the map, the precision in vector maps is determined by the precision of the points, which is often on the order of several feet. So, as you zoom in, you get better and better resolution, not a fuzzy, blocky picture.
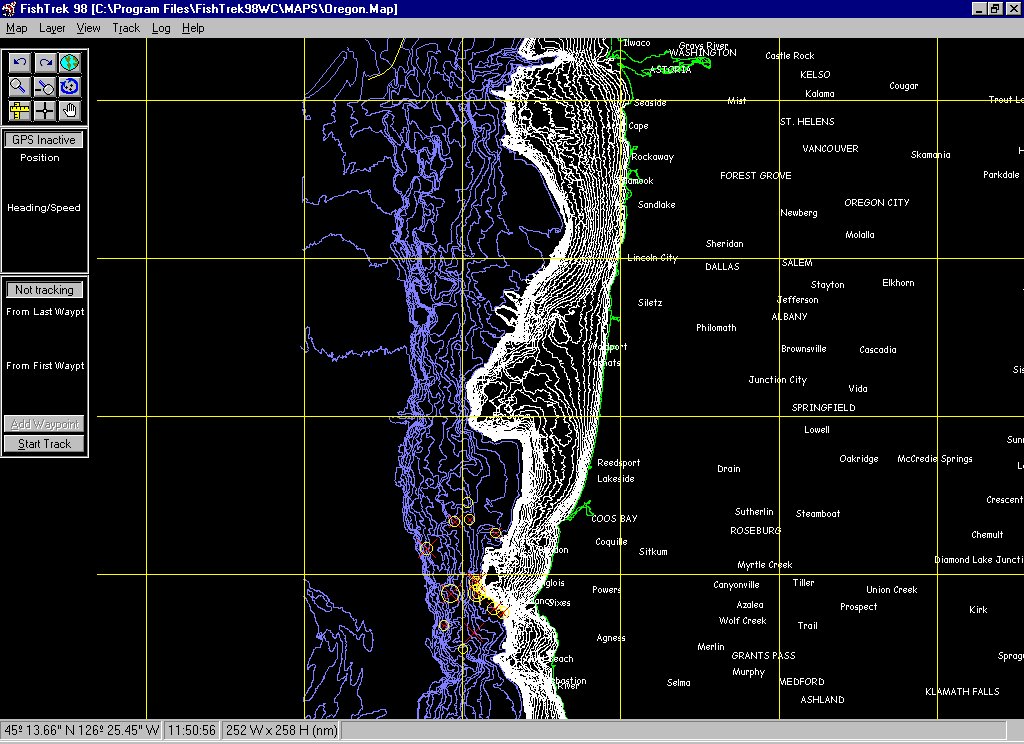
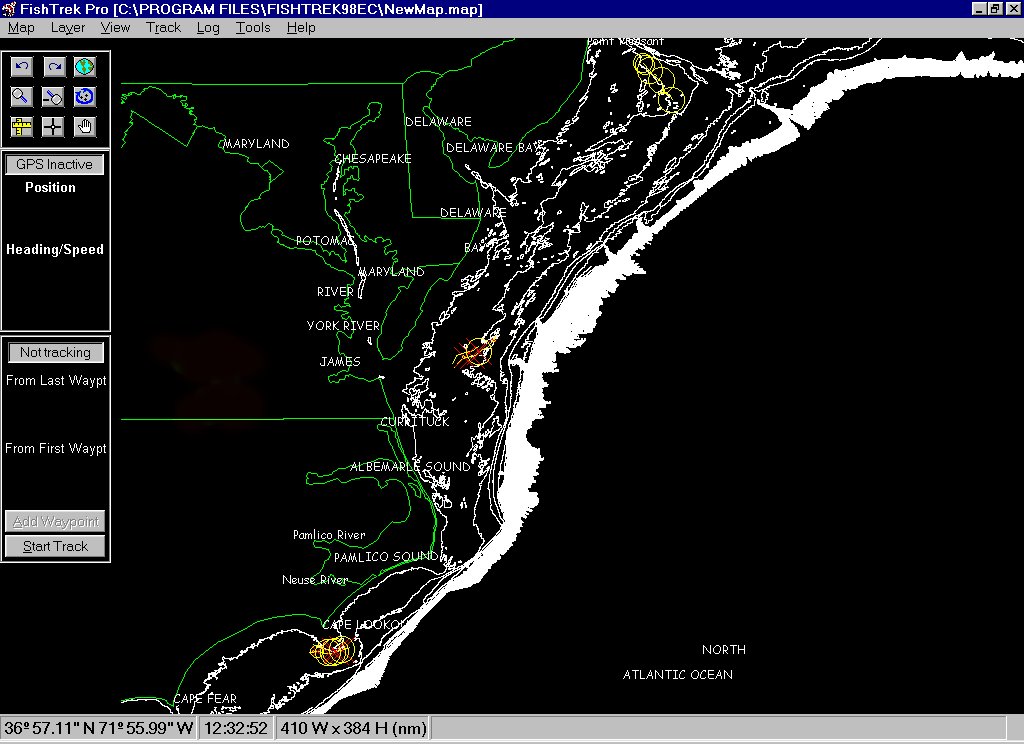
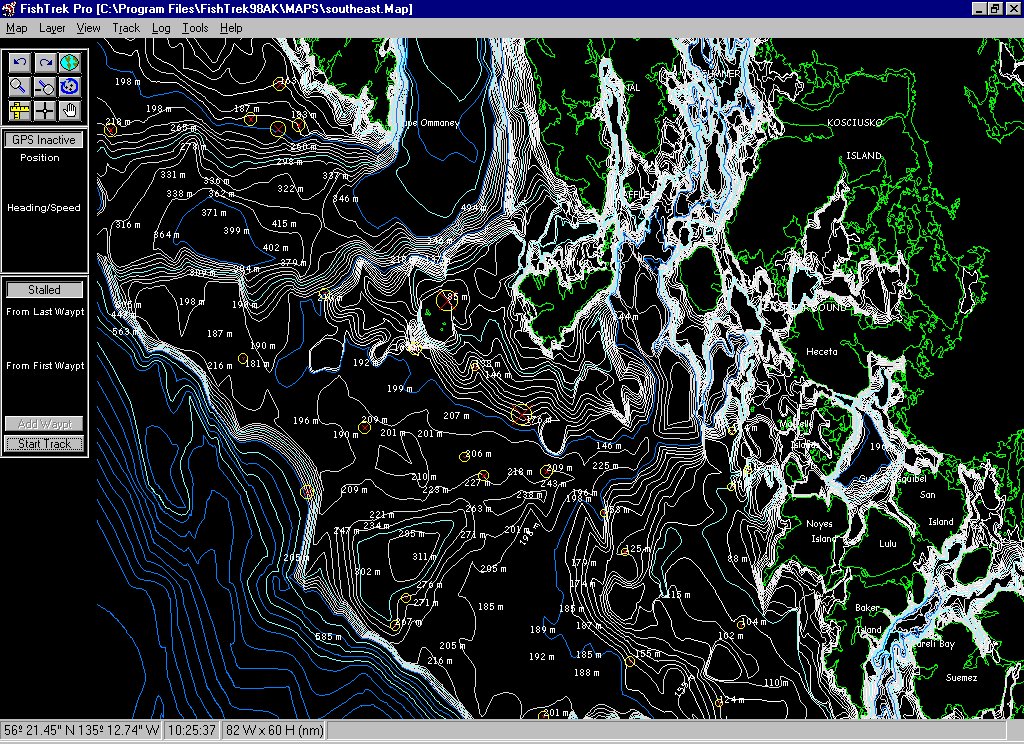
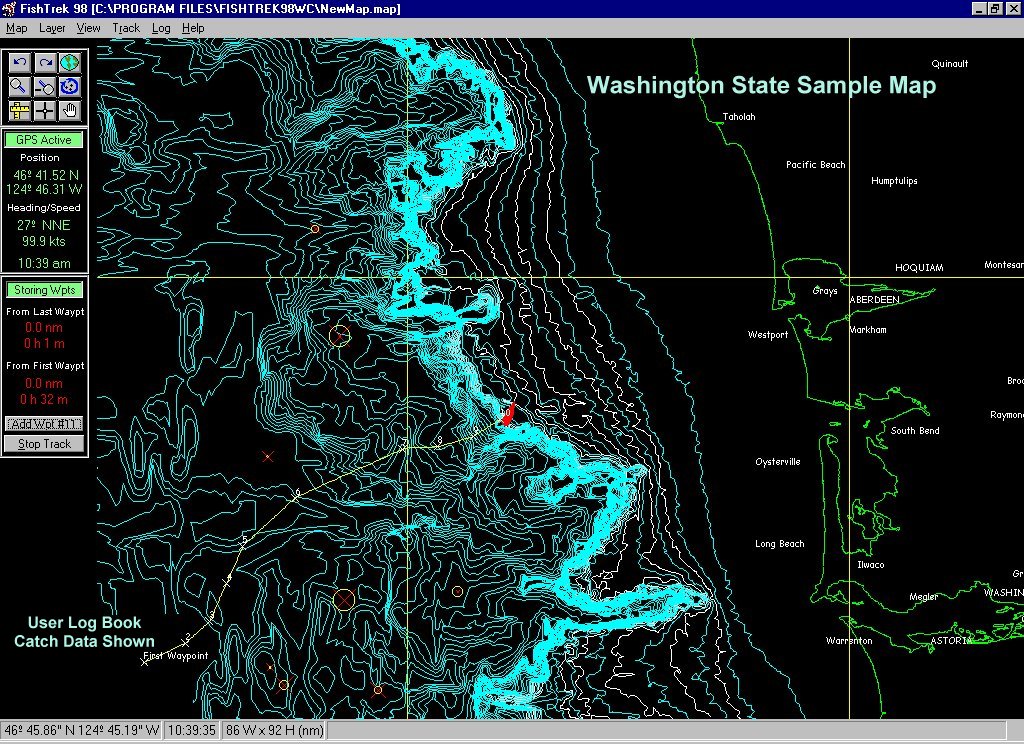
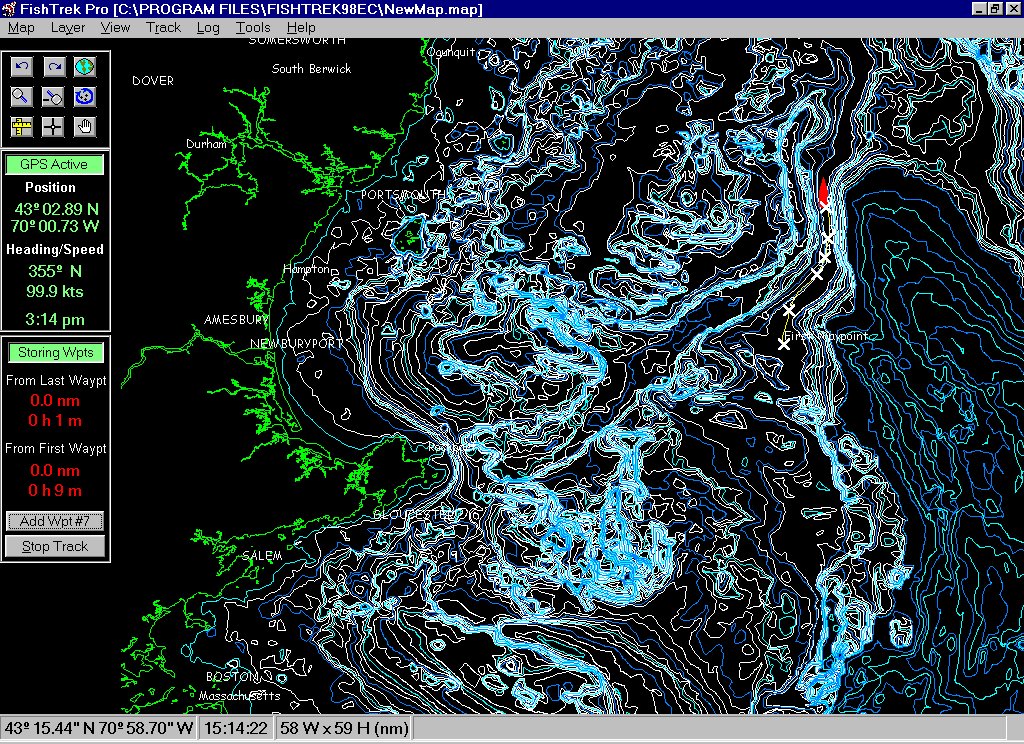
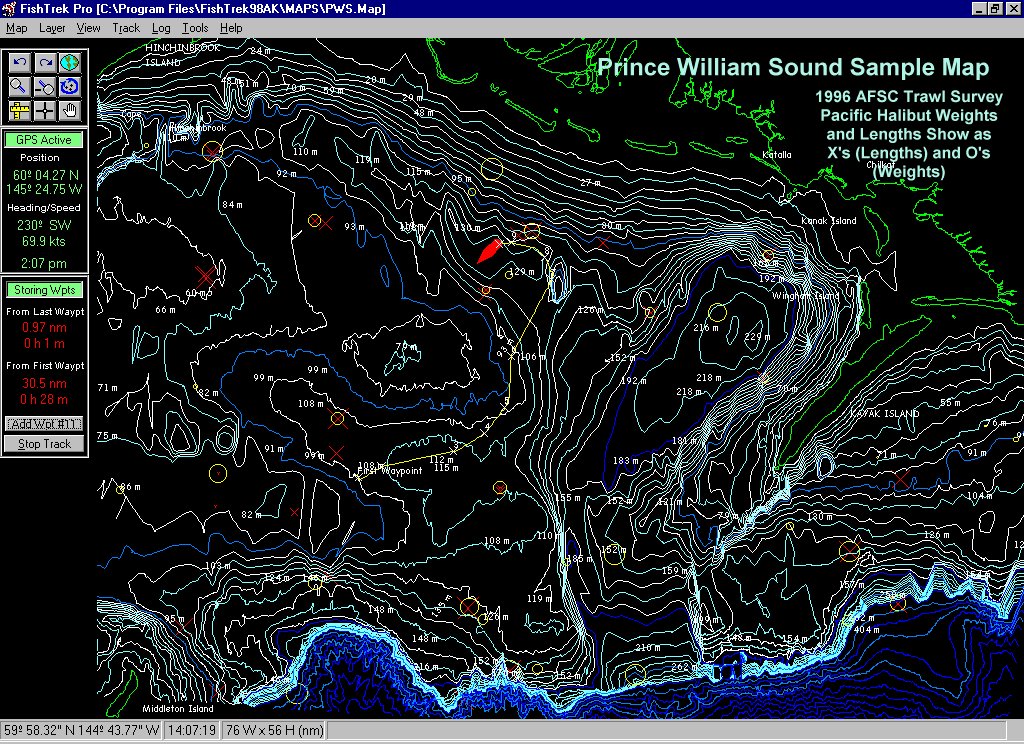
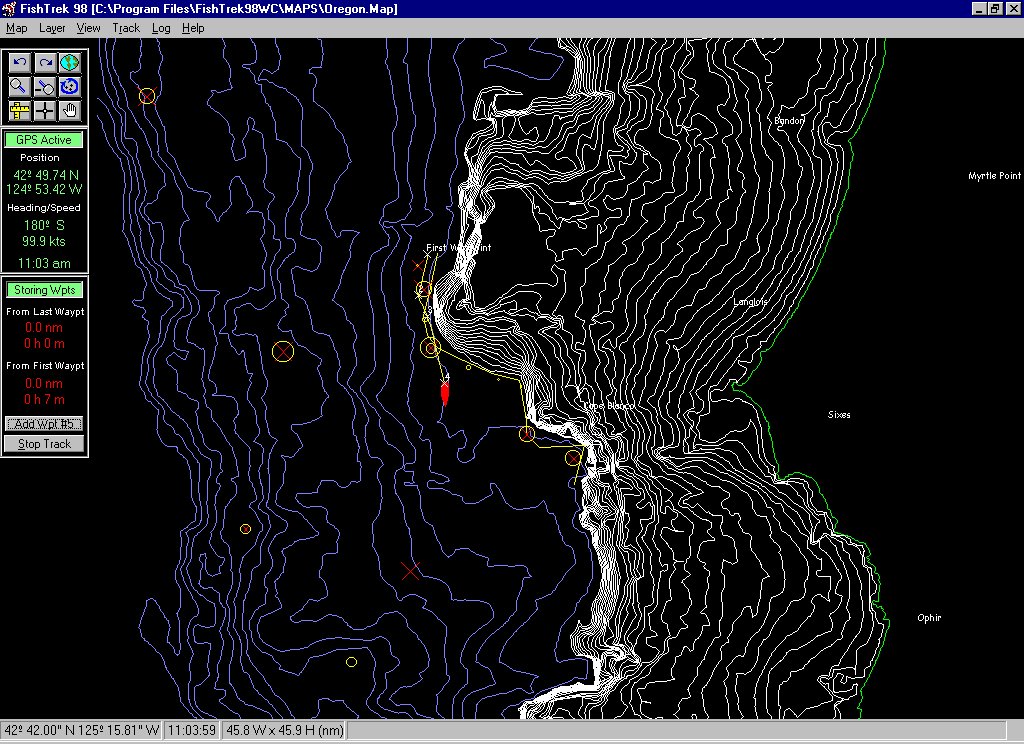
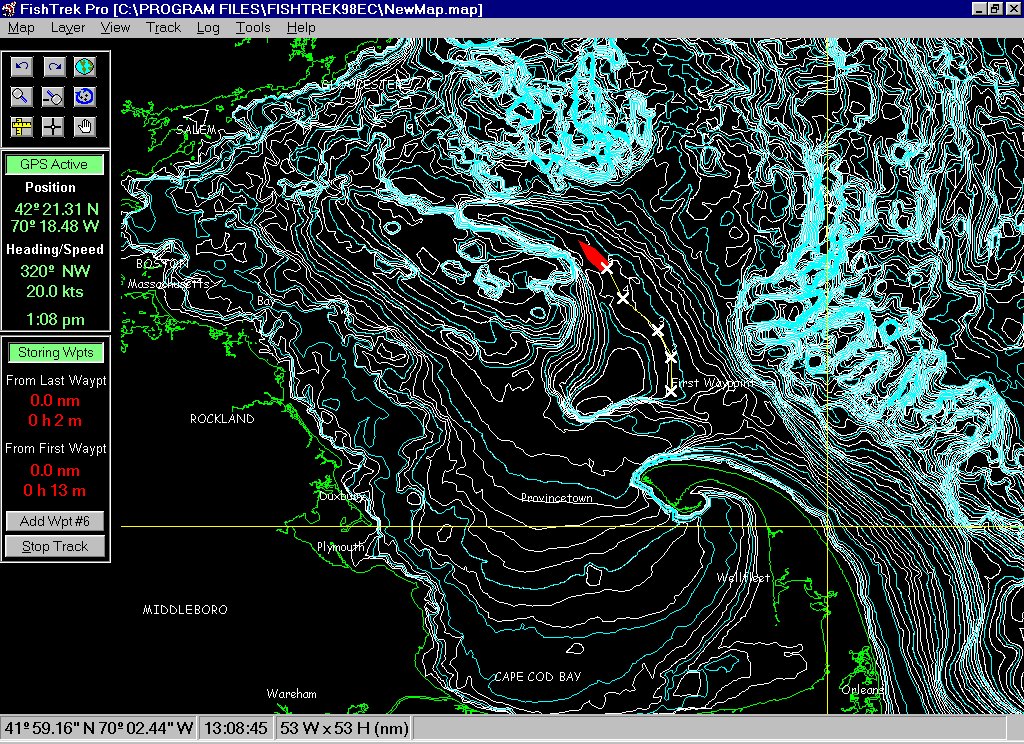
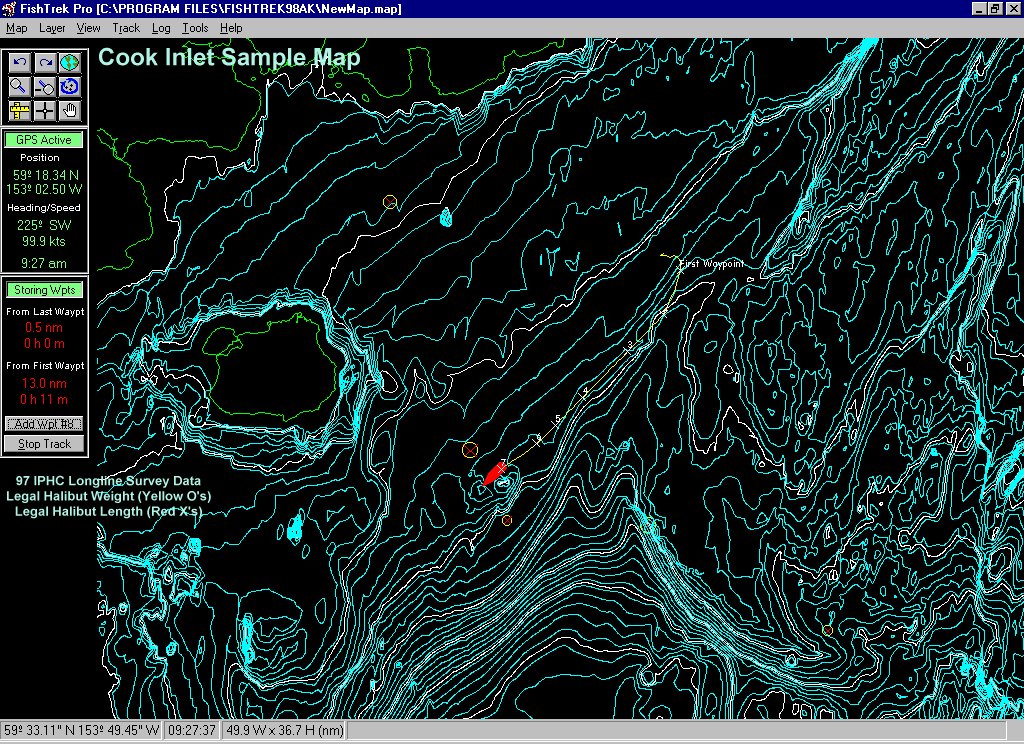
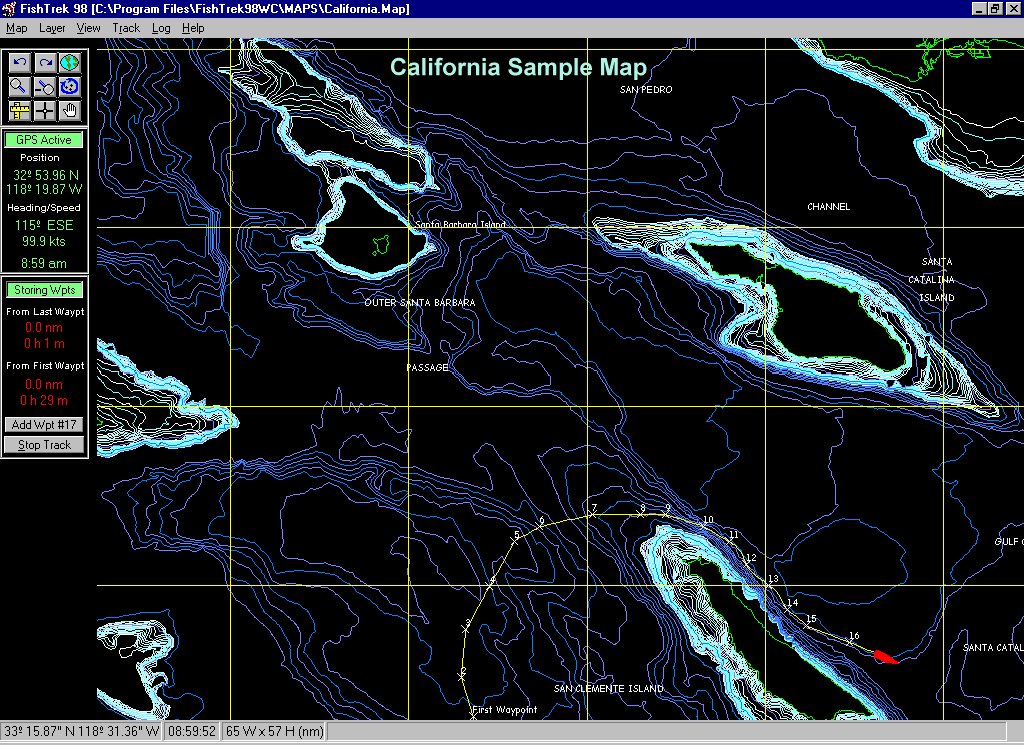
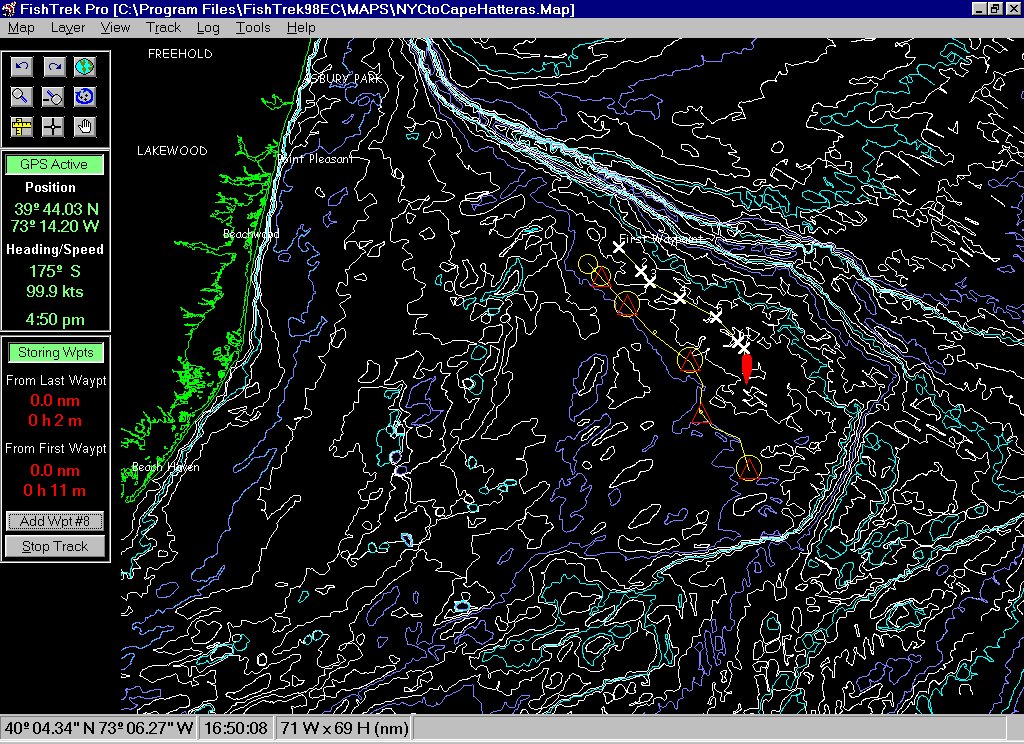
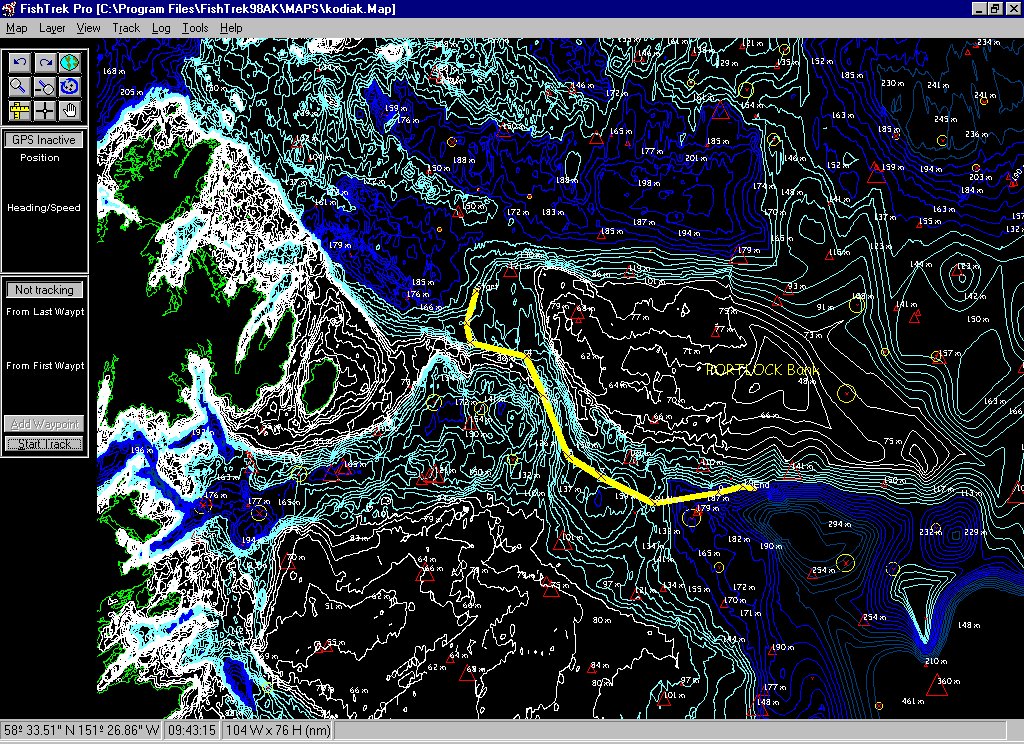
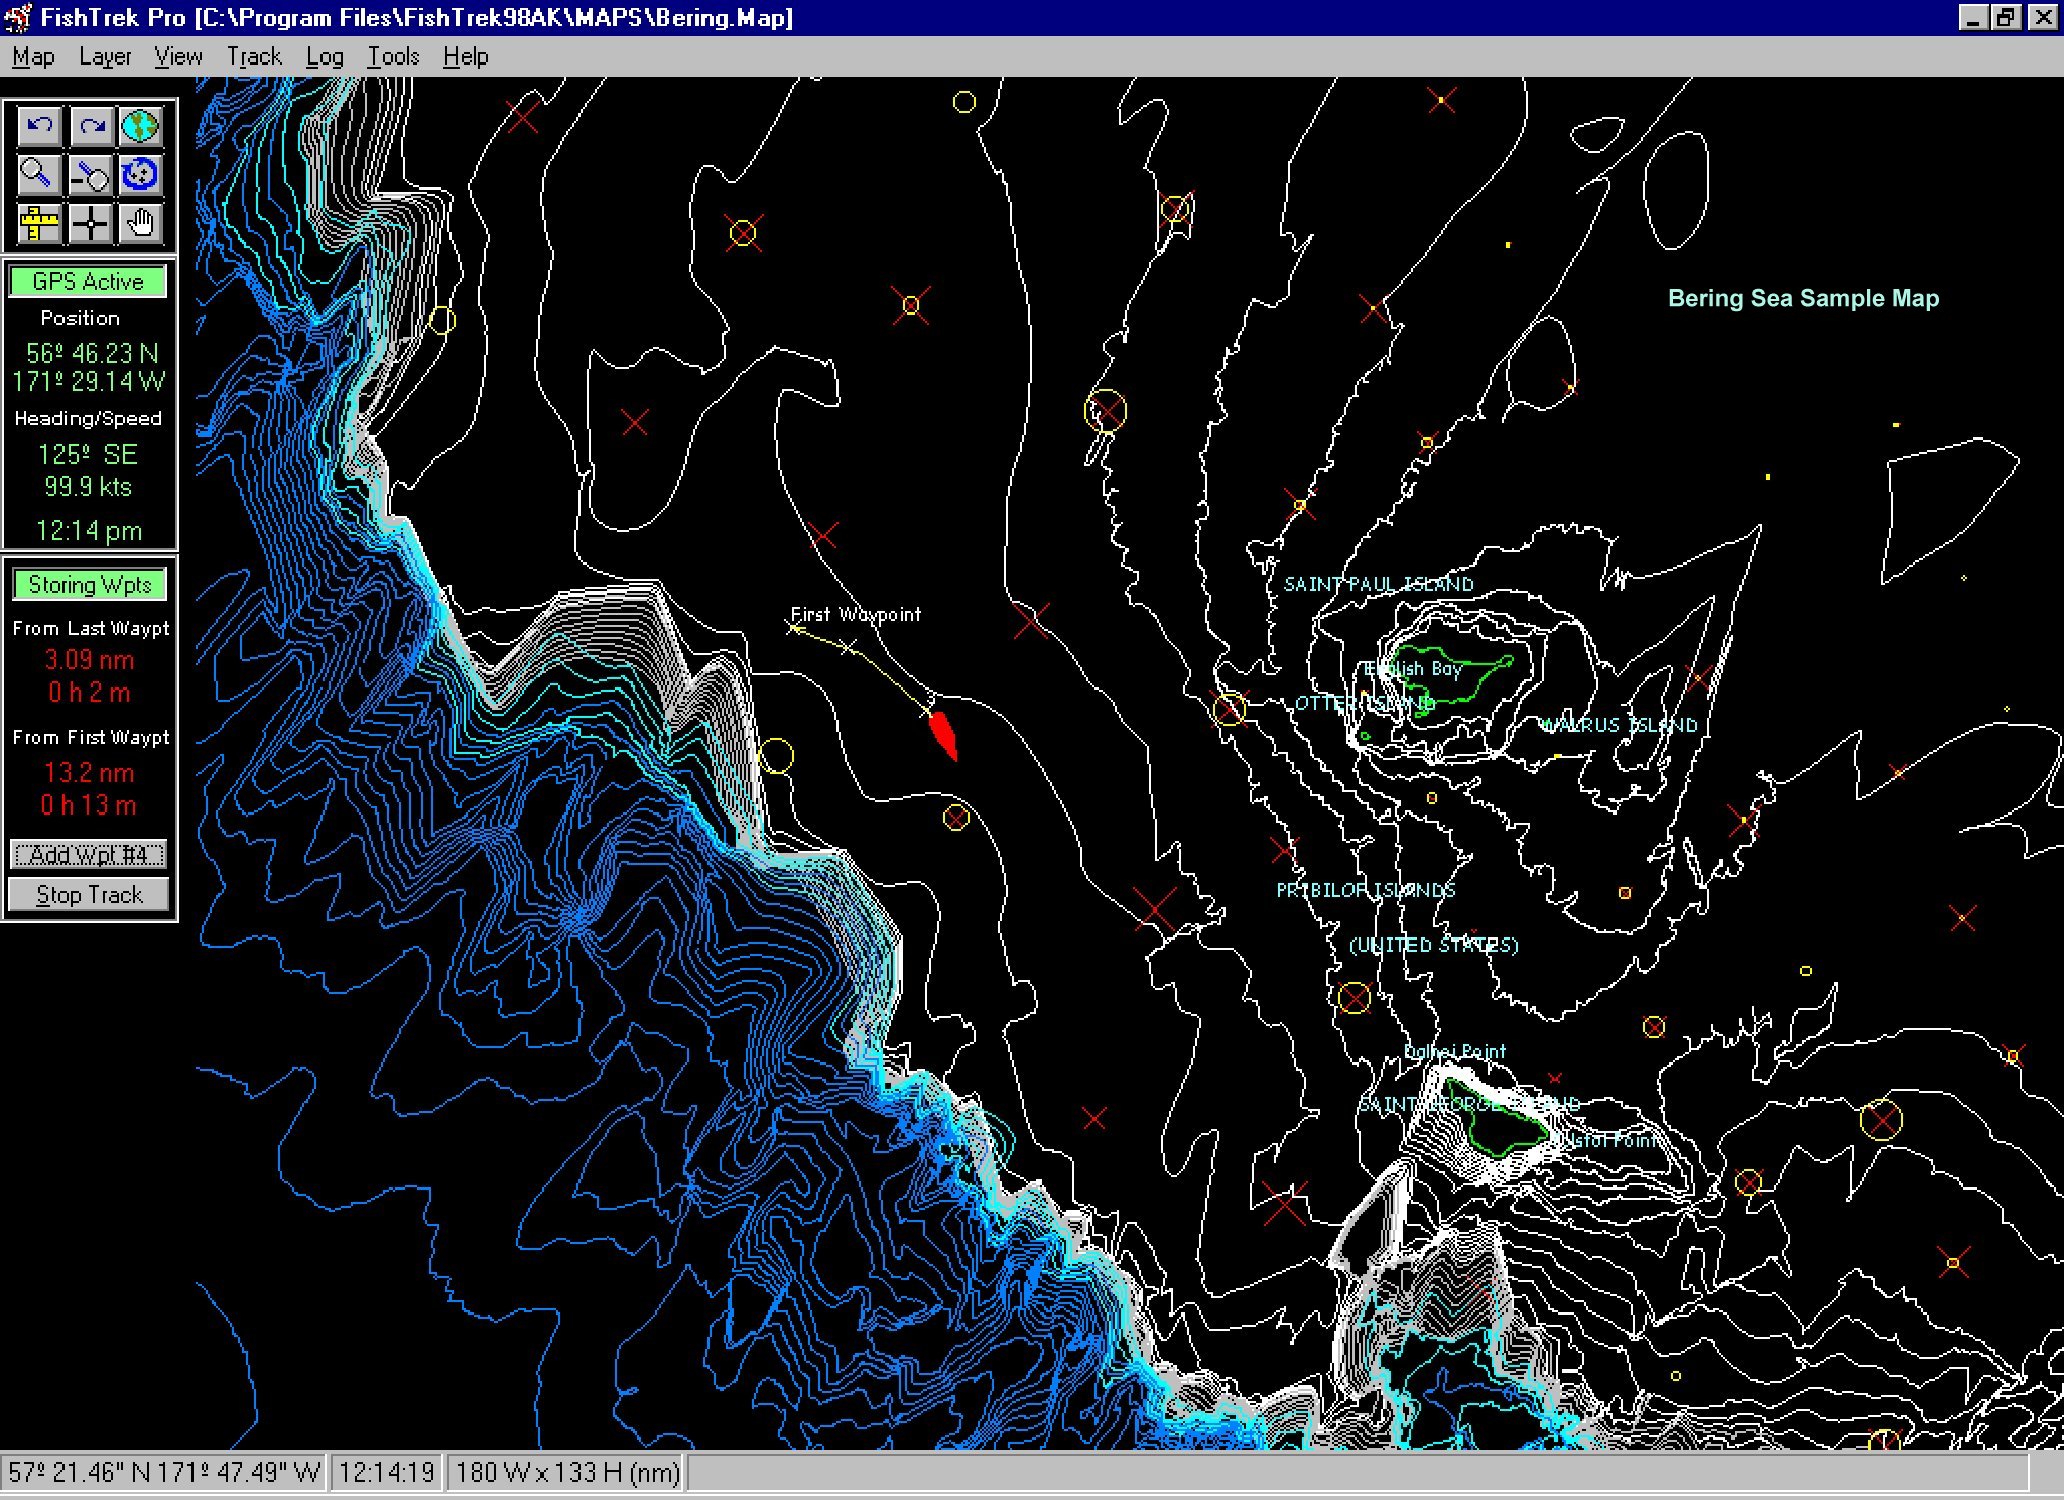
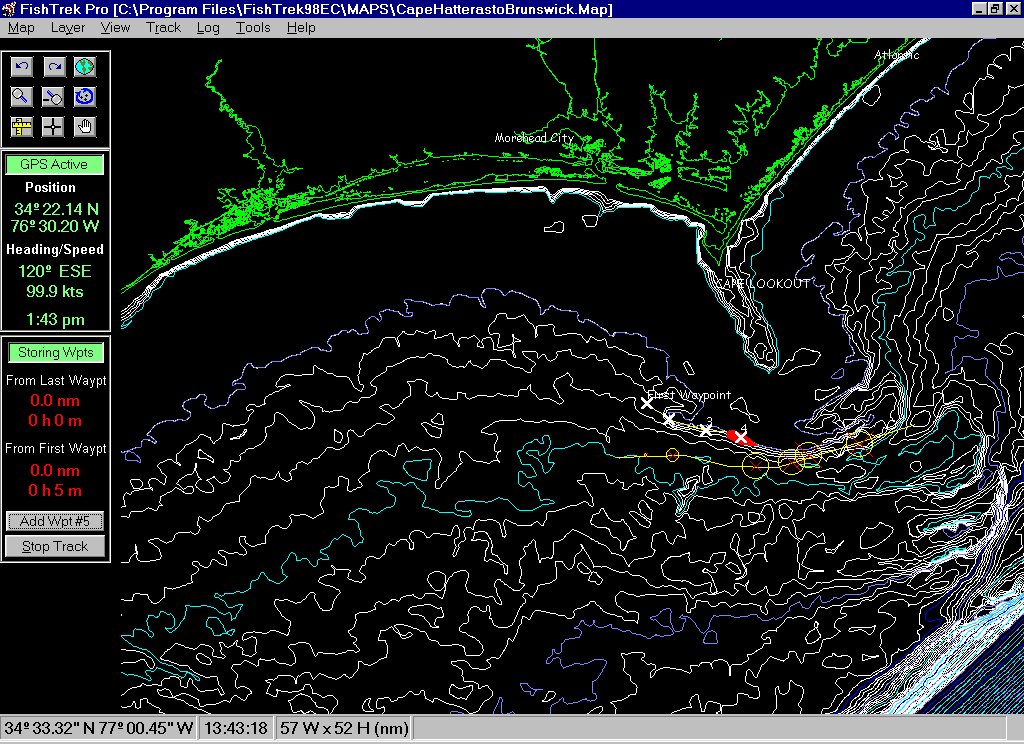
Currently FishTrek covers three regions: Alaska, West Coast, and East Coast. The Alaska region extends from Norton Sound to the Southeast Panhandle. The West Coast covers the waters from Washington to Southern California. The East Coast extends from Maine to Florida. Within each region, there are several different bathymetric maps available. As an example, the Alaska region has bathymetric maps for the Bering Sea, the Aleutian Islands, Kodiak Island, Cook Inlet, Prince William Sound, Northern Southeast, and Southern Southeast. Attached to this FAQ is a set of maps outlining the bathymetric maps available for each of these regions.
Depending on the area being covered, each set of bathymetric maps will include 3 or 4 different contour intervals to different depths. For example, the Bering Sea bathymetric data set provides 5 fathom intervals from 10 to 200 fathoms, 10 fathom intervals from 10 to 200 fathoms, 50 fathom intervals from 50 to 500 fathoms, and 100 fathom intervals from 100 to 2,000 fathoms. See the attached maps for a description of the contour intervals and depth of coverage for each area.
The regions not covered in the United States currently include the Great Lakes, Hawaii, the Gulf of Mexico, and the waters near Guam and Puerto Rico. These areas, as well as those of both Canadian coasts, are being developed now and are expected to be released within the next 12 to 18 months.
As described in the answer to the previous question, FishTrek includes a set of bathymetric contours with the purchase of a region. In addition, a low-resolution coastline, a high-resolution coastline, and a set of lat-lon lines are provided. This data, when coupled with data from your integrated electronic logbook, provides you with a very capable system.
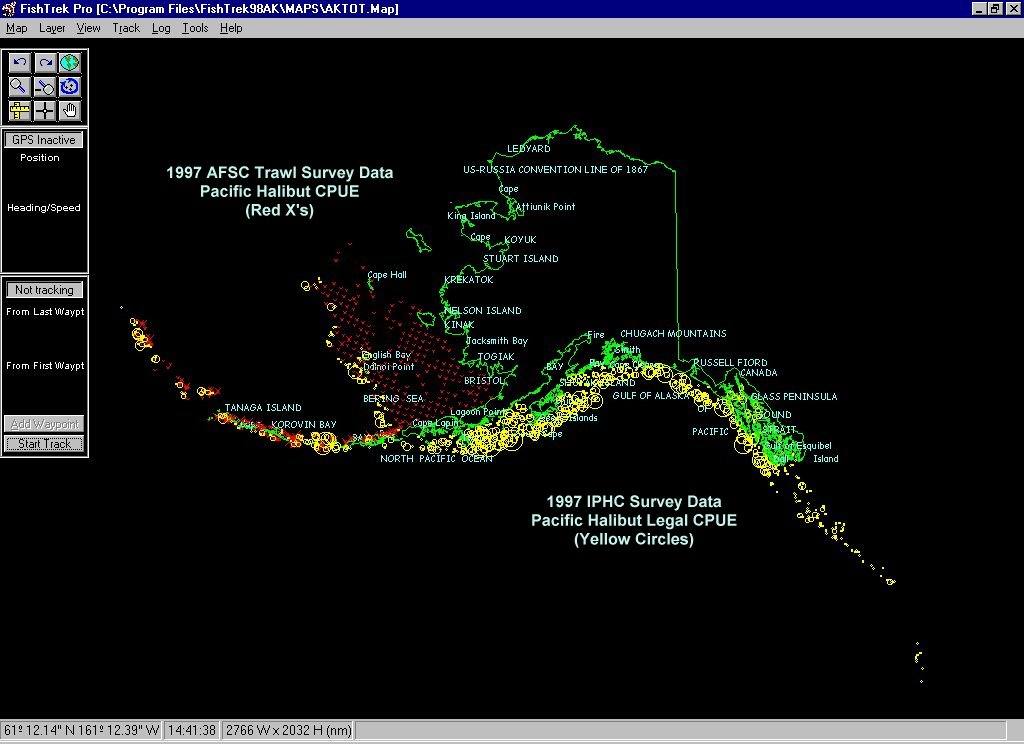
In the Alaska region, we provide some additional data products, including survey catch statistics from the National Marine Fishery Service's Alaska Fishery Science Center's (AFSC's) annual and tri-annual surveys in the Bering Sea and the Gulf of Alaska (1980 through 1997) and the International Pacific Halibut Commissions (IPHC's) longline survey data (1996-1997). We also have the gear and surface temperatures and bottom depths in the areas where the AFSC survey data was collected. FishTrek also includes snag locations collected from the trawl fleet in the Bering Sea and from NMFS during their AFSC surveys.
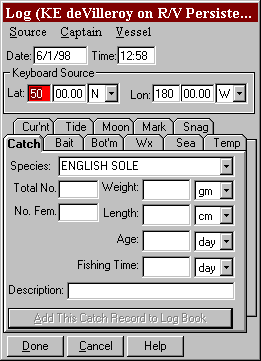
FishTrek's electronic catch logbook allows
you to store the following information:
| Catch
1. Species
|
Bait
1. Bait Type
|
Bottom
1. Sediment Type
|
Weather
1. Wx Condition
|
| Sea
Conditions
1. Sea State
|
Temperature
1. Air Temperature
|
Current
1. Stage of Tide
|
Tide
1. Stage of Tide
|
| Lunar
1. Moon Phases
|
Markers
1. Marker Type
|
Snags
1. Snag Type
|
Each logbook entry is tied to a time, location,
cruise, a captain, and a vessel. This allows you to analyze individual
trips, specific dates, and the variations from one skipper to another on
the same vessel.
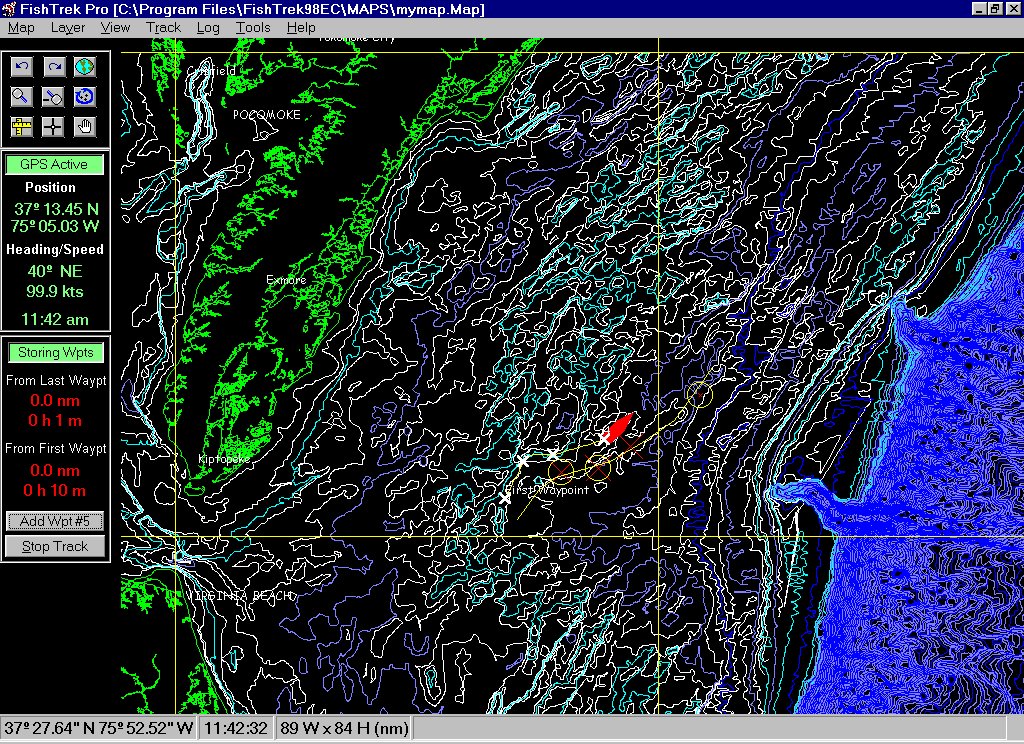
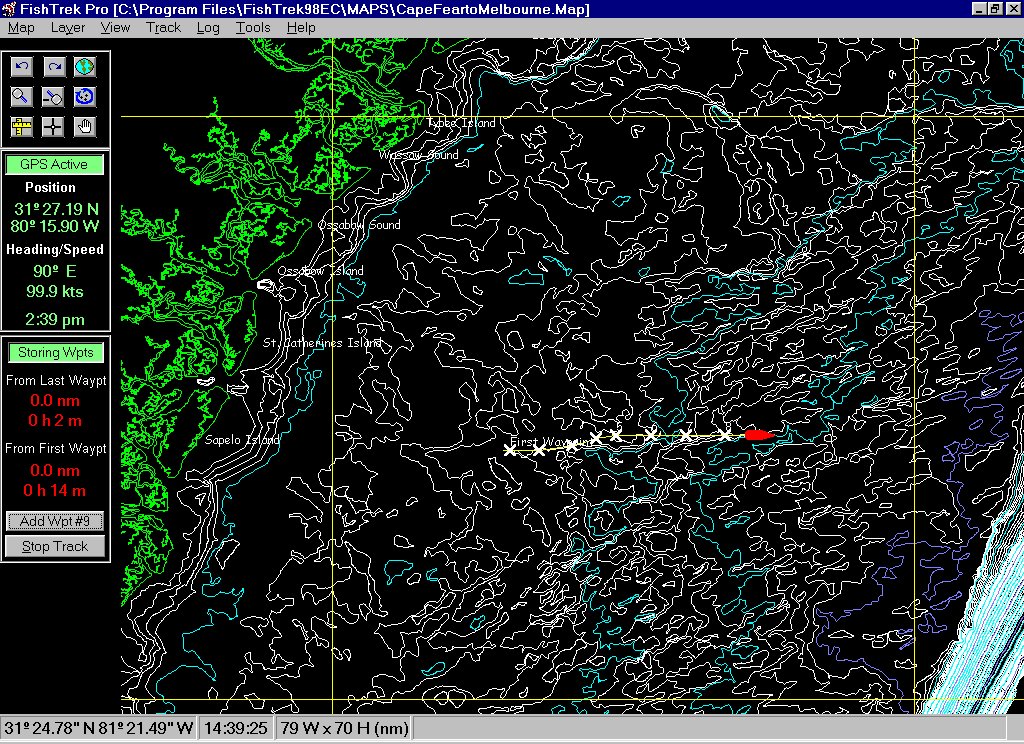
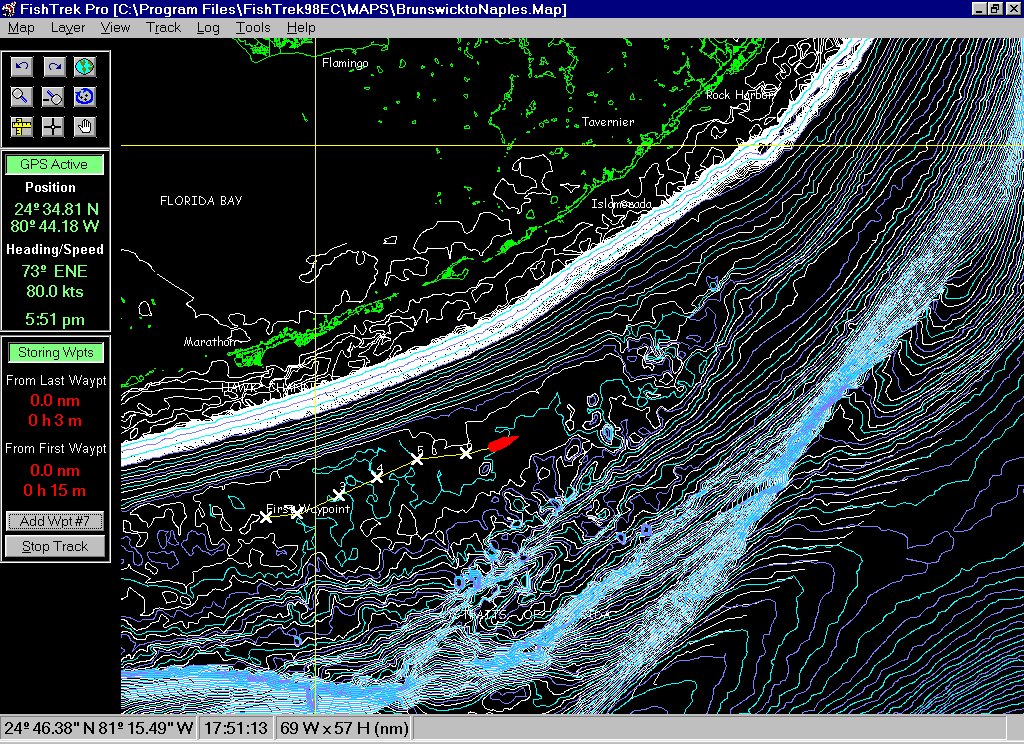
To make it easy to store logbook information, FishTrek provides several different methods of logging. Position and time information can be typed in directly from the keyboard, automatically read from the GPS, or selected from previously stored track waypoints or markers. Storing a track is as easy as starting the GPS, clicking the track start button, and hitting the return key each time you want to store a track waypoint. When you stop tracking, you can store that track and use it for data storage at a later date. As an example, you can store a track with each waypoint represent a different crab pot that was set. Each time a pot goes over the side, simply hit the enter button and the location of that pot is stored with that string. Later, when you are picking the pots, you can replay the track and attach depth data and catch amounts to each pot location.
Any logbook entry can be viewed, edited,
or deleted using FishTrek's Logbook Manager. In addition, you can build
customized reports that can be printed on a conventional computer. These
reports will show individual log entries and they provide summaries at
the end of each report for total, average, min, and max.
FishTrek 98 provides you with a system for one region (Alaska, West Coast, or East Coast) and one set of bathymetric maps (e.g. Bering Sea). FishTrek 98 provides all of the electronic logbook functions and real-time vessel display from the GPS. FishTrek 98 sells for $249.
FishTrek Pro includes everything from FishTrek 98, plus an additional set of bathymetric maps, the Ocean Contour package, and it allows you to store depth points directly from a NEMA 0183 connection to your depth sounder. FishTrek Pro sells for $495.
Additional bathymetric maps are also available for $75 per bathymetric data set.
FishTrek does provide vessel tracking from a GPS data stream coming into an RS 232 port in the back of your computer. We us the NMEA 1083 protocol for GPS transmission. At this time, we dont have loran capabilities but, if there is enough desire we will add it. The vessel track shows the location of the boat on the screen at all times and side panels on the display show heading, time, location, and speed. In addition, as you are fishing, you can lay down your own set of waypoints, store these as a track line, and later attach data to those points during logbook entry.
Yes. SciFish sells a cable that allows you to connect one GPS to two separate serial ports. One port can be configured for FishTrek and the other can be configured for your electronic charting package. Both programs can then be run simultaneously under Windows 95. In this configuration, SciFish recommends that you have at least 64 MB of RAM.
Although we have plans to include inputs from sea surface temperature sensors, trawl monitors, and other sensor packages, at this time only provide data input from the GPS and depth sounders (available only with FishTrek Pro). FishTrek requires a serial connection from the device and it will only accept NMEA 0183 data streams.
Yes, this application will run on a laptop as well as a desktop personal computer. As long as the computer meets the minimum specifications, it will run just fine.
FishTrek requires 32 megabytes of memory, at least 200 megabytes of free hard disk space, a 166 megahertz Pentium CPU, Windows 95 operating system, a color monitor, and at least one serial COM port for the GPS (and a second free serial COM port for the depth sounder in FishTrek Pro). FishTrek does not provide a GPS.
SciFish spent a great deal of time and money developing the bathymetric contours for FishTrek. The data that is used to contour is primarily from the National Oceanographic Data Center's digital archives. Unfortunately, this data is not complete, especially in Alaska. There are many locations where there is missing data -- we call these "data holes." SciFish has filled these data holes by going to the actual nautical charts at the best resolution available and entering the depths from those charts. To date, SciFish has entered nearly 100,000 of these data points. After the data is entered, it goes through a quality control process that compares the entered data against nautical charts and the available coastline to make sure it reconciles and there are no anomalies. Following this, we contour the data using an advanced contouring package capable of handling hundreds of thousands of points and with a wide variety of parameters that can be adjusted to create the best presentation of the data. Once were satisfied with the presentation of the data, then we do another quality control check to make sure there were no additional anomalies introduced by the contouring itself. Then those contours are exported and formatted for FishTrek. As a result of this process, SciFish is able to provide greater coverage than any of the existing bathymetric packages to date with the most accurate contours possible.
FishTrek Pro provides a contouring package that allows the user to contour personal depth points. This means that you can now enter those data points inside the electronic logbook and put them up on the map. Once theyre on the map they can be contoured, generating a new set of contours which can be stored and then brought up on the map at a later time. However, the contours created will not be as accurate as those SciFish provides with the application, as there are many fine nuances of contouring which are not available. In those locations where there is either not any data available or where higher precision is required, it makes sense to allow the ability to generate your own set of contours for any location based upon the user depth points for that area.
SciFish is a member of NASAs Earth Science Information Partners (ESIP) Federation and is responsible for the development of data products for the fisheries. The data products that we envision to have are sea surface height (altimetry), sea surface temperature, sea surface currents, and weather information. These data products are planned for the next release and will be delivered as email attachments. The goal of this development process is to deliver timely and accurate data sets that indicate those areas with the greatest concentration of target species and the least amount of bycatch.
For more information on remotely sensed data products for the fisheries, click here.
FishTrek includes a backup and restore function. Data that is collected on the boat can be backed up into a single file that can be moved from one computer to another and restored. The software license you purchase with FishTrek allows you to install FishTrek on your home computer. The ability to take the data from you boat and use it in the home office is one that we believe will be quite useful, as it will allow you to review your data in the comfort of your home and analyze your catch history and catch records and do planning prior to your next trip. Then, while you are on the boat and working, we made it as simple as possible to enter data.
Of course, performing regular backups is also a good practice to ensure you have a duplicate copy in the event of a disk crash.
The backup/restore function is like others you may have used. It will completely wipe out the last copy of the data and replace it with the current copy. So, if you enter data into your electronic logbook at two different locations simultaneously, it will not be possible to merge those data sets at this time.
SciFish has priced this package at a point that provides an affordable solution for virtually any fisherman and still retain a modest profit. As for why other packages cost so much, you'll have to ask them.